

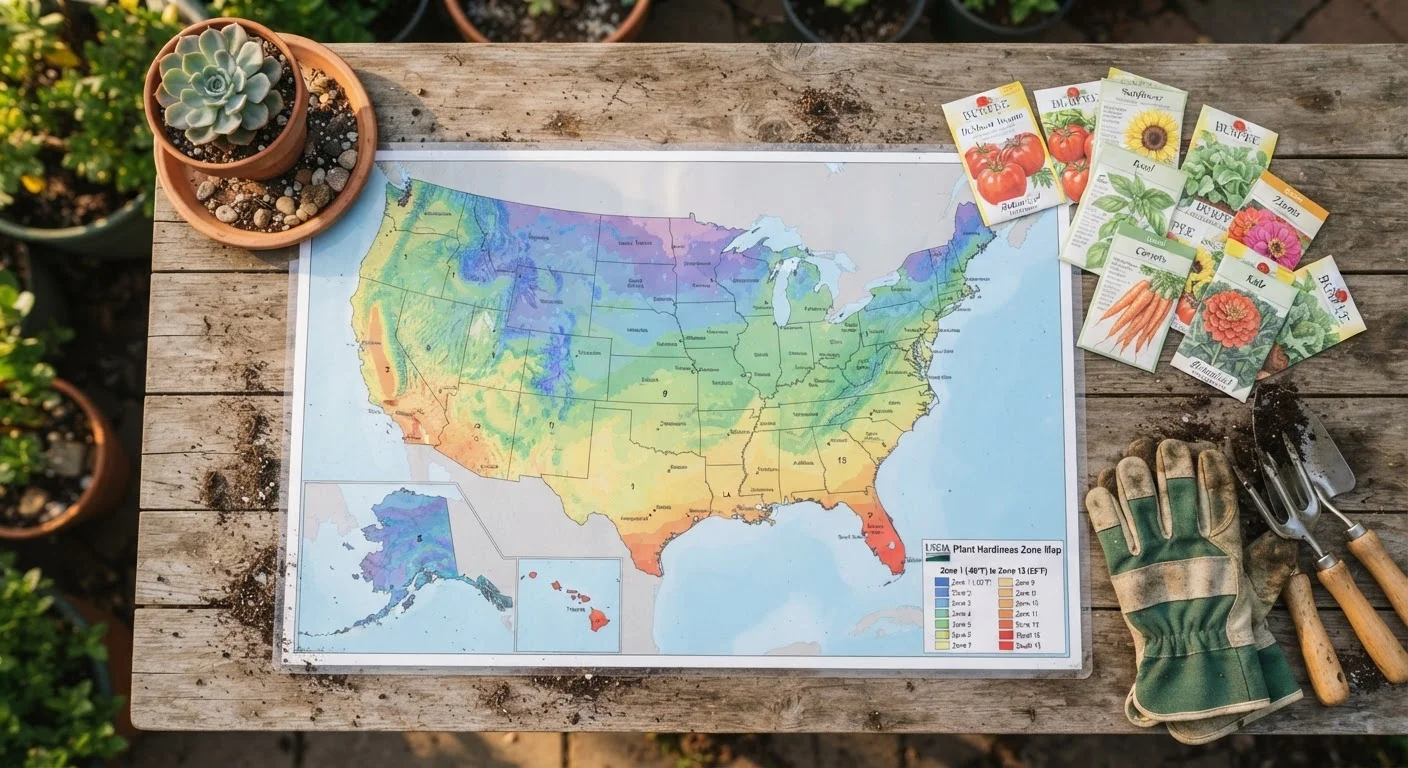
What the Zone Number Actually Measures
The USDA Plant Hardiness Zone Map divides the country by one specific metric: the average minimum temperature recorded over a 30-year period. Zone 3, for example, sees average winter lows between -40°F and -30°F. Zone 10 rarely dips below 30°F. Each zone is further split into "a" (colder half) and "b" (warmer half), each representing a 5°F difference.
When a plant tag lists a zone range - say, "Zones 5-9" - it's telling you the coldest and warmest climates in which that plant has been observed to reliably survive winter outdoors. Below Zone 5, the plant would likely freeze to death. Above Zone 9, the plant may not get the cold dormancy period it needs to thrive. That's the only claim the zone number is making.
Reading a plant label carefully alongside its zone rating gives you a much more complete picture of what a plant actually needs before you buy it.
26
Half-zones in the USDA map
The USDA Plant Hardiness Zone Map divides the U.S. into 13 zones, each split into two 5°F half-zones, for 26 distinct designations in total.
2023
Year of the most recent USDA map update
The USDA updated its hardiness zone map in 2023 using 30-year climate data from 1991-2020, shifting about half of U.S. locations into a warmer half-zone.
86°F
Heat zone threshold temperature
The American Horticultural Society's Plant Heat Zone Map tracks days per year above 86°F, a separate metric hardiness zones do not capture.
What Zones Don't Tell You
Here's where many gardeners run into trouble: hardiness zones say nothing about summer heat, humidity, frost dates, rainfall patterns, wind exposure, or soil type. A plant rated for Zone 7 might be available at your local nursery in Zone 7 New Mexico and Zone 7 North Carolina - two places with dramatically different summers, humidity levels, and rainfall. Both fall in the same zone, but they grow very different plants successfully.
The American Horticultural Society developed a separate Plant Heat Zone Map precisely because summer stress - measured as the number of days per year above 86°F - is an equally important survival factor for many plants. A gardener in Phoenix and a gardener in coastal Virginia may share a hardiness zone but need entirely different plant selections.
Two Maps, Two Different Questions
The USDA Plant Hardiness Zone Map answers: "Can this plant survive winter here?" The American Horticultural Society's Plant Heat Zone Map answers: "Can this plant handle summer here?" For regions with extreme summer temperatures - the Deep South, the Desert Southwest, or high-humidity Mid-Atlantic - checking both maps before selecting perennials, shrubs, or trees is worth the extra step.
Soil drainage, elevation, and proximity to bodies of water can shift conditions dramatically as well. A low-lying frost pocket in your backyard may behave like a zone colder than your official rating, while a slope with good air drainage may behave warmer.
Understanding Microclimates in Your Yard
Your property almost certainly contains more than one effective growing climate. A south-facing brick wall absorbs daytime heat and radiates it overnight, potentially keeping that spot 5°F to 10°F warmer than open ground nearby. A low spot that collects cold air drainage on still nights can suffer frost when the rest of your garden does not.
Observing these patterns over a season or two - noting where frost hits first, where snow melts earliest, which corners stay wet longest - is genuinely useful information that no map can give you. Experienced gardeners often push their zone limits by deliberately placing marginally hardy plants in the warmest microclimates on their property.
Track Your Yard's Microclimates
Keep a simple garden notebook or use your phone's notes app to record where frost appears first each fall and where snow lingers longest in spring. After one full year, you'll have a clearer picture of the cold pockets and warm spots that no zone map can show you. That information will help you place plants with much greater confidence.
For a structured approach to seasonal planning that accounts for your specific conditions, see our year-round garden planning reference, which walks through what to monitor and plant at each time of year.
Using Zone Data as a Starting Point, Not a Final Answer
The most practical way to use hardiness zone information is as a first filter. If a plant is rated for Zone 9 and you're in Zone 6, it's unlikely to survive your winters outdoors without significant protection - that's worth knowing before you spend money on it. But passing the zone test doesn't mean a plant will automatically do well in your garden.
After checking the zone, investigate the plant's preferred soil pH and drainage, its sun and water requirements, and whether local pests or diseases make it a risky choice in your region. Your state's cooperative extension service publishes regionally specific planting guides that go well beyond zone ratings - they're free, reliable, and written for your actual conditions.
The zone map is a tool, not a guarantee. Think of it the way you'd think of a weather forecast: it gives you useful probability information, but the outcome still depends on dozens of variables playing out in real time in your specific space.
Frequently Asked Questions
It means the plant can generally survive minimum winter temperatures down to 0°F to 10°F, which is the range typical of Zone 7. Plants rated below your zone should survive winter outdoors; those rated above it may not. Zone ratings are a survival threshold, not a guarantee of good growth.
Visit the USDA Plant Hardiness Zone Map website (planthardiness.ars.usda.gov) and enter your zip code. Your zone will display instantly. Your local cooperative extension service can also confirm your zone and offer region-specific planting advice.
Sometimes, yes - by using microclimates or protection strategies like mulching, cold frames, or planting near a south-facing wall that retains heat. These methods can extend your practical growing range, but results are not guaranteed and depend heavily on your specific site and the severity of each winter.
The 2023 update incorporated 30 years of temperature data from 1991-2020, replacing the previous dataset ending in 1986. Warmer average minimums recorded during that period shifted roughly half of U.S. locations into a warmer half-zone. It reflects measured climate trends, not a prediction.
No - they measure different things. Hardiness zones reflect average minimum winter cold. The American Horticultural Society's Plant Heat Zone Map separately tracks the average number of days per year above 86°F. Some plants need both metrics to determine suitability for your garden.
The content on this site is for informational purposes only and is not a substitute for professional advice. Always consult a qualified professional for guidance specific to your situation.